Editor’s Note: This article was originally published by Web Marketing Today. Practical Ecommerce acquired Web Marketing Today in 2012. In 2016, we merged the two sites, leaving Practical Ecommerce as the successor.
I often reference both Google Analytics and Webmaster Tools when writing about SEO for small business owners. These are the two most important resources available for digital marketing analysis and are free for anyone to use.
Once set up for your website, they can communicate with each other to show you what pages perform best in search engines. From there, you can apply what you know about SEO and website usability to make improvements that drive conversions and customer acquisition on your website.
Linking Analytics and Webmaster Tools
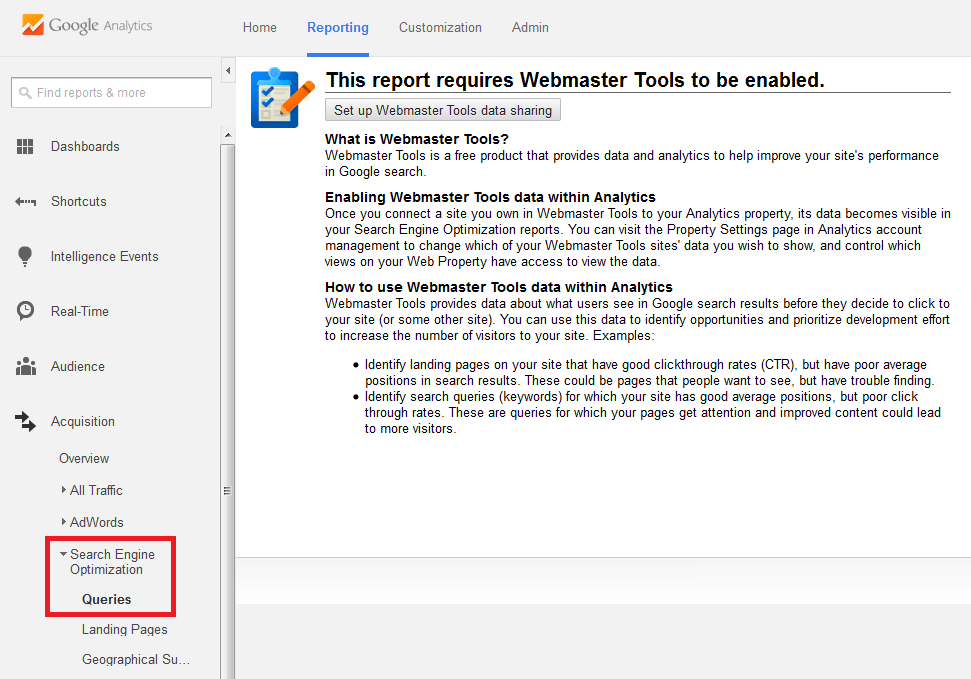
When you access the Search Engine Optimization report group for the first time, Google Analytics will prompt you to link a Webmaster Tools account.

Link Webmaster Tools to Google Analytics.
Follow the steps to link the accounts, specifying the default view to use and your business’s industry category. Enable advertiser features, demographic reports, and in-page analytics, if desired.
Once linked, the accounts will take about a day to begin displaying data in the Google Analytics Queries, Landing Pages, and Geographical Summary reports.
The Queries and Landing Pages reports are of particular interest. Studying the data they present provides insights into the keywords that surface the website in searches, as well as the pages that display most frequently to searchers.
The Google Analytics SEO reports show you how well your site performs in search, at the same time revealing opportunities to amplify results on well-performing pages.
Queries Report

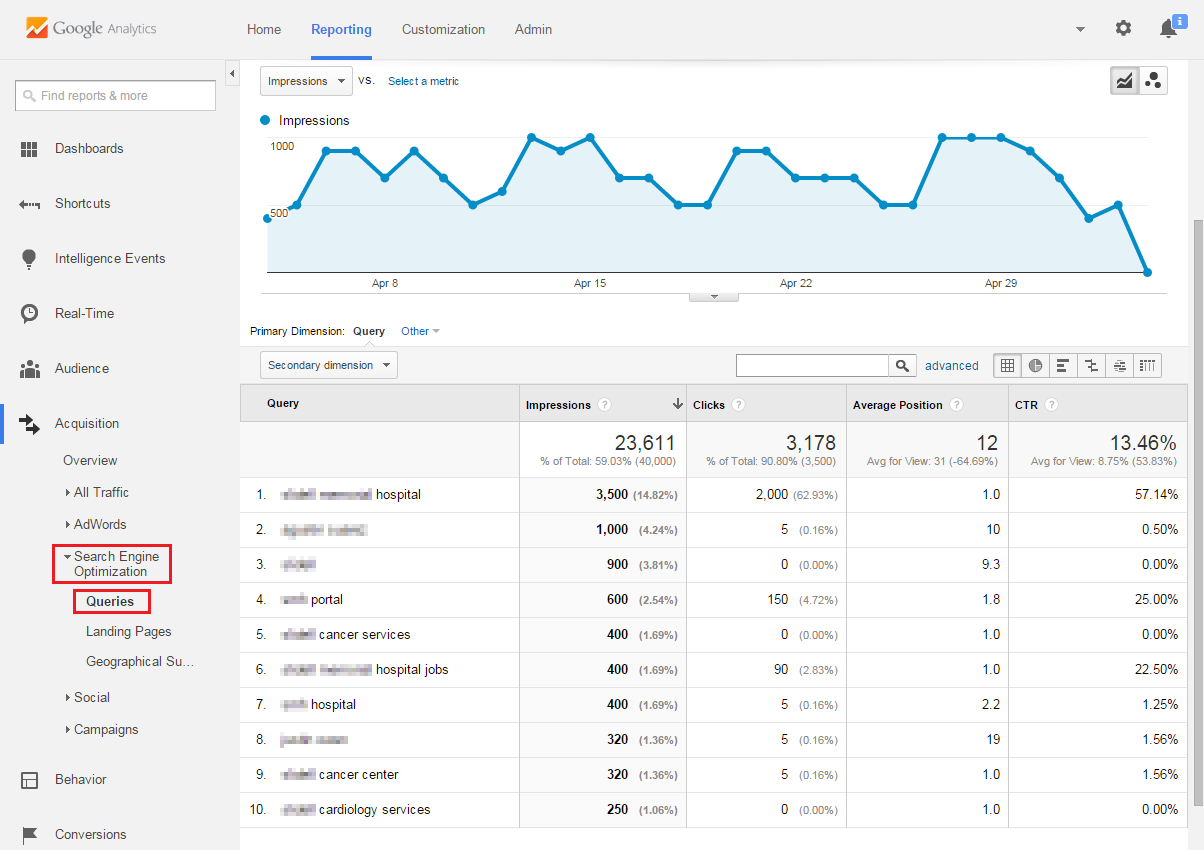
Google Analytics Queries Report
Keep these four key terms from the Queries Report in mind.
- Impressions. The number of times your website was displayed in a search result for a given query. In the screenshot above, the query (search term) that caused the site to show most often was the hospital’s brand name.
- Clicks. The number of times someone clicked through to your site after it displayed in search results.
- Average Position. Your site’s average rank in search results for a given query. In the screenshot, each of the queries with an average position of “1.0” include the hospital’s brand name.
- CTR (Click-through rate). The percentage of impressions that resulted in a site visit.
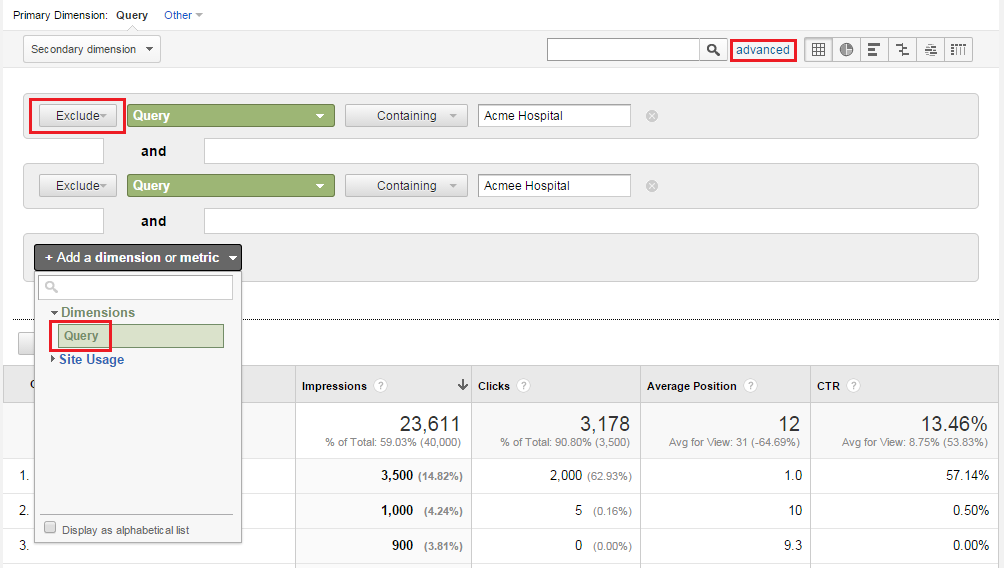
For businesses with solid brand recognition, queries including the brand name will dominate the top spot in this report. Use the “advanced” search option to exclude queries that contain the brand name and variations thereof, including misspellings.

Use the “advanced” search option to exclude brand name queries.
Once you clear the report of branded searches, you can get a picture of which search terms drive displays of and visits to your website.
Keywords that you have worked into the copy and meta data on your website should begin to generate impressions. If not, make changes to their placement and frequency, or take a look at whether links to your site include the keywords in question within the anchor text.
Usually, the queries report will include some phrases you don’t expect to see. You may recognize a specific phrase from your web copy even though you may not have focused on it in your SEO efforts.
Since these phrases already have some traction, it makes sense to include them in your SEO.
Landing Pages Report

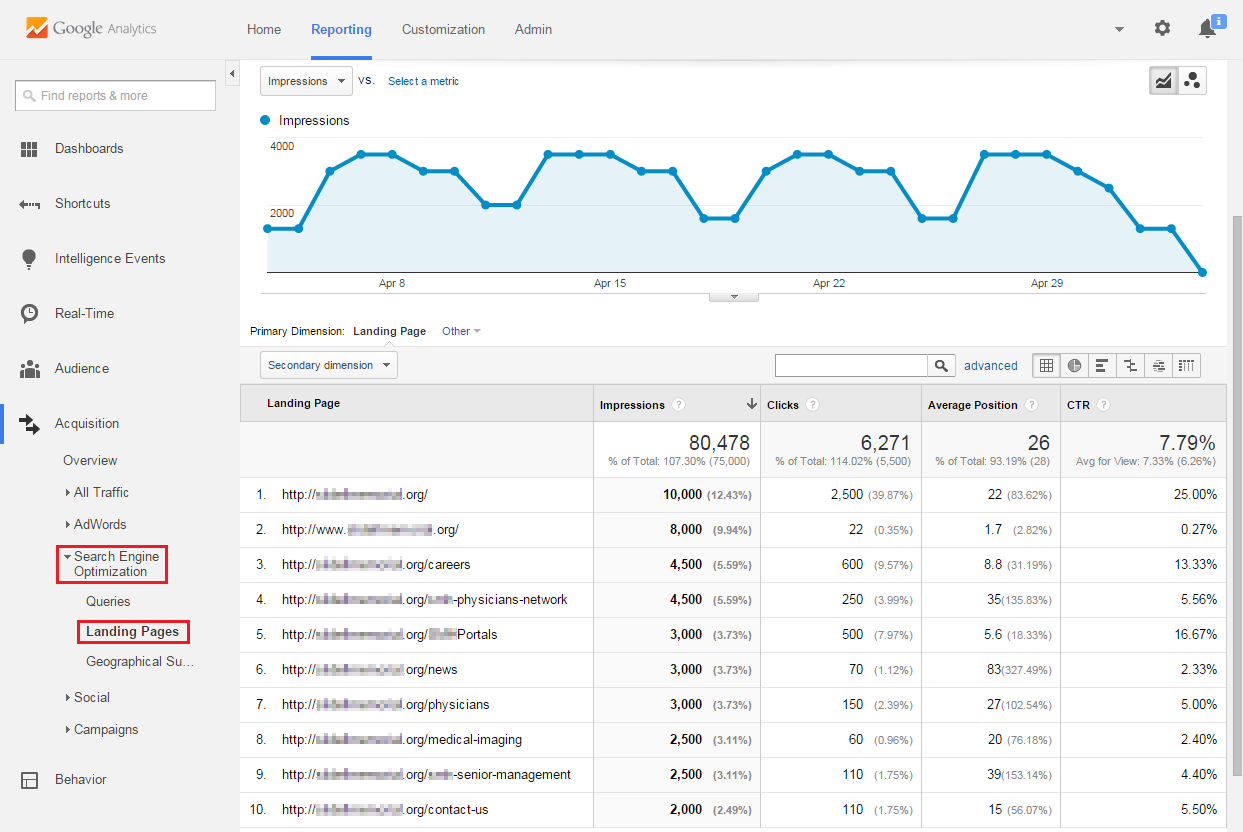
Landing Page report shows pages displayed in search results.
You will see the same dimensions from the Queries report on the Landing Pages report. However, instead of search terms, the report lists individual pages being displayed in search results.
Typically, the homepage is at or near the top of the list. Sort the report by the various dimensions to see which pages display most frequently, which ones attract the most clicks, and which rank the highest when displayed.
Armed with this information, you can make changes to encourage more click-throughs and engagement.
High impressions, high CTR. In this situation, a page is displayed often and most people who view it navigate through to your site. These pages deserve a lot of attention as they serve a wide audience of people who may have different needs or objectives. Be sure these pages are well-organized with clear navigation options.
Low impressions, high CTR. Fewer people look for the content on these pages, but when they see them in search results are reasonably confident that you have the answer to their questions. These pages may deserve additional optimization to generate more impressions, but they should provide a clear call-to-action related to the information on the page.
For example, if the page contains an MSDS or other product documentation, make it easy for people to buy the product, request a quote, or download additional content from your site.
High impressions, low CTR. These pages represent an opportunity for you to flex your title and description writing muscle. Title and meta description tags influence the way search engines display results.

Title and meta description tags influence the way search engines display results.
The title tag makes up the blue link at the top of the result while the meta description is the gray descriptive text beneath the title.
If your pages have a high number of impressions, but people aren’t enticed to visit your site, consider modifying the title or description.
The title tag is a search ranking signal, so it’s in your best interest to include your primary keyword. Don’t make the critical SEO mistake of sacrificing readability for the sake of keyword placement — rather be sure your page title accurately describes the page content.
The meta description does not influence a website’s ranking but functions as advertising copy for your page. Write descriptions with a compelling, direct-response orientation, encouraging readers to click through and explore all you have to offer.
Summary
Combine the power of Google Analytics and Webmaster Tools to understand how people find your website in search engines. Using the Queries and Landing Pages reports, you can get an idea of which keywords perform the best, find new opportunities for keyword optimization, and make changes to metadata to attract more visitors.


