Editor’s Note: This article was originally published by Web Marketing Today. Practical Ecommerce acquired Web Marketing Today in 2012. In 2016, we merged the two sites, leaving Practical Ecommerce as the successor.
Business websites typically have conversion goals for their visitors to act on. Whether it’s purchasing a product, filling out a form for more information, or signing up for a webinar, the initial step in the path to goal completion is a landing page, the first page a visitor encounters on the site.
Google Analytics measures the effectiveness of this first impression by calculating the number of goal completions — i.e., “Goals” created in Analytics — against the number of people that saw that page. That ratio (completions divided by total visitors) is the conversion rate.
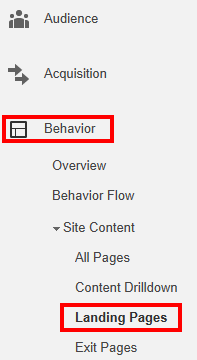
One can view landing page metrics in Google Analytics in a number of ways. But the easiest to access is under the “Behavior” menu, then “Site Content,” then “Landing Pages.”

Landing pages navigation in Google Analytics.
Dissecting Landing Page Metrics
When you first encounter this report, your landing pages are listed in descending order based on the number of visits. As with any Google Analytics report, you can sort on any of the displayed measurements by clicking on the column headings. Those headings are as follows.
- Visits. The total number of times this was the first page a visitor saw.
- Percentage New Visits. What percentage of these visitors were on your site for the first time?
- New Visits. The total number of first-time visitors to that page.
- Bounce Rate. The percentage of visitors that viewed only this page, and did nothing else.
- Pages/Visit. The average number of total pages viewed by people who hit this landing page.
- Average Visit Duration. Total time spent on the website.
Those measurements will always be there. The next three columns are for ecommerce sites. Here are the additional measurements.
- Transactions. The total number of purchases generated by that landing page.
- Revenue. Sales in dollars generated by this page.
- Ecommerce Conversion Rate. The percentage of visitors who purchased.
For lead generation and other sites, there are these additional measurements.
- Goal Conversion Rate. The percentage of people who took the goal action on your website.
- Goal Completions. The total number of goal events that occurred.
- Goal Value. If you’ve attached a monetary value to a goal completion, it will be tallied here.
Making the Data Actionable
Once you have collected the data, the challenge is using it to make your business stronger. On its own, the data is simply a window to the past. You need context for the numbers so that we can make sound business decisions.
For an ecommerce store, the conversion rate is key. Ensure that the product images, sales copy, and price all make the visitor take the next step to purchase. It’s good practice to compare conversion rates on different products, to establish an overall baseline.
In the image below, one product page has a conversion rate of 9.3 percent, which is outstanding. What is it about that page or that product that makes it outperform all other landing pages? Remember, this is a landing page report, so this product is the first thing those visitors see.
In this case, I know that the product is unique, and that a social-media flash sale occurred during the measured time period. That’s additional context. Always look to see how the page performs under normal circumstances as well, for a better understanding.
For lead generation websites, a good landing page to analyze is the home page. How often does the home page influence a visitor’s decision to contact you?
If you think about it, it’s likely that a visitor that arrive at your home page first knew your company existed, and either did a brand related search or directly typed in your website URL into the browser bar.
We should therefore consider these to be warm leads from the start. And it follows that your home page would convert better than your other pages. If it doesn’t, consider redesigning it. Something is preventing visitors from completing your goals.
For lead generation websites, a good landing page to analyze is your home page. How often does the home page influence a visitor’s decision to contact you?
Over time, when you work with this report regularly, you’ll likely develop an understanding for normal percentages. If you are making changes to your site based on the report, be sure to annotate the dates for those changes directly in Google Analytics, so that it’s easy to compare and contrast.
Further, you can develop ideas on types of pages, and how they influence your conversion rate. For example, you may find that visitors who see a product category page first are less likely to buy than those that first see the product itself. Perhaps there’s a way you can redesign those category pages. In particular, if both the bounce rate is much higher and the conversion rate much lower, you have a new project to work on.
In short, remember that the landing page report measures how you introduce your site to potential customers, and reacquaint it with old ones. Your landing pages are vital. Look at this report often and act on it.


