Say you’re running a paid-search marketing campaign for your ecommerce site. To maximize performance, you’d like to know:
- Who is visiting your site;
- How they are getting there;
- What they are interested in;
- Demographics: age, gender, interests.
If you’re using Google Analytics, you can gather this information with a small one line of code upgrade — from ga.js to dc.js. Once the code is upgraded, here is a snapshot of the type of demographics data that you’ll have in your Google Analytics reports. This sample report is from a winter sports site that seeks to attract 25-to-34 age males.

By upgrading their Google Analytics code, ecommerce merchants can collect demographic data.
I’ll elaborate. When you first look at your Audience > Demographics > Overview reports, it will display the age categories and gender of your site visitors. This is valuable information. It gives insights about your visitors, which helps market your products, what content to develop, and how to engage them. New visitors are likely to research the products you offer and, based on what they search on, you will know which promotions are working by age-gender-interest and correlate which products are popular with specific age groups. (If you are using Universal Analytics, demographics functionality is not yet available.)
Embrace the New Reports
While having the audience data at your fingertips is interesting, merchants must know how to use it to help increase online sales. Start with paying close attention to the insights you get from the data. For example, we should not be satisfied with just the top-level report, above. We should drill down and look for answers to specific ecommerce questions. This will greatly help with your segmentation efforts.
You can easily set up meaningful Advanced Segments, such as this one.
- Gender: Female
- Age groups: 25 – 34 and 35-44,
- Affinity Category: Travel Buffs
You could call this segment, “Female – Age 25-44 Travel Buffs.” (Click here to create it in your Google Analytics account.)

This segment in Google Analytics focuses on females, aged 25 to 44, that are interested in travel.
Moreover, say you want to compare the user behavior and the type of user interactions these visitors have compared with their male counterparts. (Click here to create this separate segment in your Google Analytics account.) Apply these two segments and go to Behavior > Events > Top Events to measure content interaction, such as photo views, video plays, and downloads.

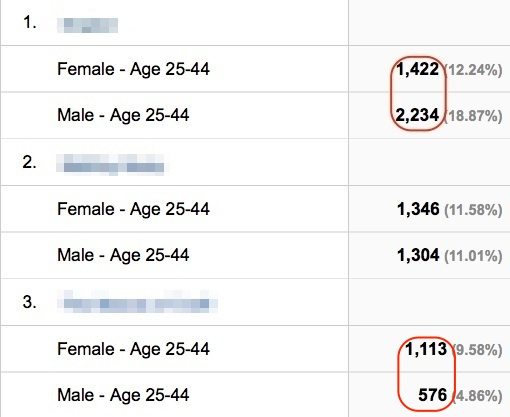
In this report, females responded to the content much better than males
In this example, there is a significant difference in content consumption. For example Event Category 3 had roughly twice the interactions by females (1,113) compared to males (576). You now know what’s engaging for your female visitors. This is actionable information in terms of a future content strategy, such as email marketing and promotions.
Sharing your Content
Different age groups exhibit different behaviors when it comes to sharing content. You can use this to your advantage and gain insight by segmenting your traffic by age and seeing what content is popular with each group.
You could generate a report on social sharing (Acquisition > Social > Network Referrals), to understand how your users are sharing across their social platforms, and how to better harness that.
For instance, say you run a campaign on social media. You could look at yesterday’s data to gain insights on user engagement. In the example below, the most active age group when it came to sharing was 25-34 and its social networks of choice were Twitter and Google+.

This report on traffic from social media channels shows visitors aged 25 to 34 respond the best.
On your social media outlets, you could then offer a discount or a promotion on products that are likely to be attractive to the 25-34 age group. This not only engages the visitors but also draws more traffic and sales.
By glancing at the table you can see the age ranges you are attracting.


