Google Analytics provides impactful data that can help ecommerce merchants. But installed incorrectly, Google Analytics can produce inaccurate reporting. And a faulty analysis of Analytics data can lead to the wrong actions.
In this post, I’ll address common mistakes from merchants in installing Google Analytics and analyzing its data.
Installation Mistakes
Missing Google Analytics tags, incorrect tags, duplicate tags, or incorrect tag placement can produce misleading or flawed data. I’ve addressed the ramifications (and diagnosis) of improper tag setup, at “How to Audit Google Analytics Data, for Ecommerce.”
Referrals from hosted payment platforms, such as PayPal, can skew reporting as customers leave a merchant’s site to process the payment and then return to complete the transaction. Earlier this year, I explained how to track PayPal transactions.
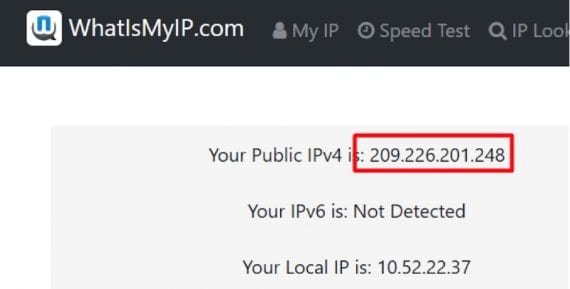
Self-referrals. Reporting traffic of employees and company insiders can lead to erroneous data. Make sure your office, home, and company IP addresses are excluded. (An exception is reporting sales from phone-in orders.) To prevent the reporting of internal traffic, first identify the IP addresses of each user.

WhatIsMyIP.com can identify office, home, and company IP addresses.
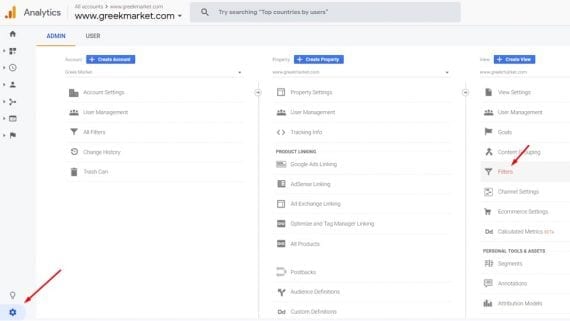
Then go to click the “Admin” gear icon on Google Analytics and click the “Filters” link.
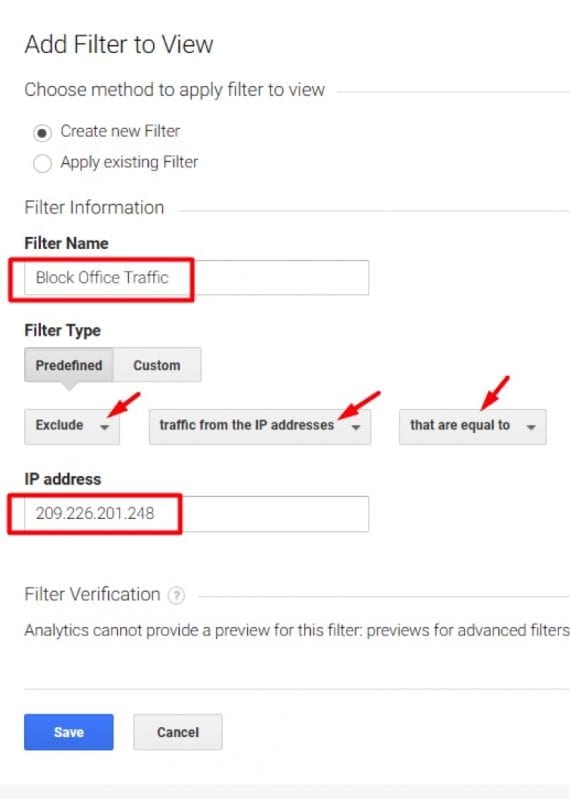
Name the filter. Select Exclude > traffic from the IP address > that are equal to. Then enter your IP address and click “Save.”

Select Exclude > traffic from the IP address > that are equal to. Then enter the IP address and click “Save.”
Not importing cost data from all paid channels. In the absence of reporting returns on investment, conversion rates are helpful for comparing revenue channels. But the cost of those channels varies. Importing the cost provides meaningful data on profits, not just sales or raw conversions. For more, see “Using Google Analytics to Optimize Bing Ads and Other Channels.”
Analysis Mistakes
Analyzing click paths. The path analysis in Google Analytics is difficult to follow, and the takeaways are limited in my experience. Instead of looking at the paths of users, create a funnel for the path-to-purchase, and identify steps that create the most abandonment. Users will do some strange things on your website. Attempting to make sense of click behavior at a detailed level is not productive.
Relying on last-click revenue reporting. Most of the revenue reports in Google Analytics use last-click attribution — i.e., the last customer click receives credit for the sale. But this may not present the full picture. To identify if shoppers use multiple channels (such as paid search, organic search, social media) to reach your website prior to purchase, see “Using Google Analytics to Track Multiple Ad Channels in Purchase Cycle.”
Using short or incomplete timeframes. Use month-to-date or previous month results and then compare to the same period last year. This indicates whether your business is growing year-over-year, to take action if necessary. Comparing to previous periods — such as June 2019 vs. May 2019 — does not consider seasonality. Year-over-year comparisons do.
Smaller merchants have less traffic. Analyzing short time windows often fail to provide enough data to draw accurate conclusions. If necessary, compare six-month intervals year-over-year.
Ignoring conversion rates and revenue. Merchants often focus on bounce rates, average page views, and average time on site instead of conversion rates and revenue. That is misguided. Certainly high bounce rates (over 40 percent), low average page views (less than three), and low time on site (less than 1 minute) are undesirable. But the goal is conversions and profits.
For paid search, identify keywords that convert poorly and have poor engagement. Reduce bidding on those keywords or pause them altogether. Expect traffic from organic search to have higher bounce rates than from paid channels or direct. Social media traffic tends to have low engagement rates.
But there’s still value in organic and social traffic. Optimize your path-to-purchase to squeeze out more conversions and revenue from those channels.
If your site has poor engagement overall but profitable conversion rates, you likely have bimodal user behavior — some visitors find what they want, but many do not. In that case, A/B test your value proposition. Retool if necessary.


