There is an abundance of analytics data for ecommerce businesses. Finding actionable insights, however, requires persistence and hard work. But it pays off handsomely.
In this article, I’ll describe three standard Google Analytics reports that could — without additional probing — provide misleading conclusions.
1. Click-through Rates and Costs per Click
Many site owners and marketing managers focus on tracking click-through rates (CTR) and costs per click (CPC) of their marketing campaigns. These are important metrics and should be monitored and optimized. But if you are not monitoring effects on conversion, then who cares how high or low the CTR is? It’s the ultimate conversion that contributes to the bottom line.


Conversion rate comparison example.
In the report above, Campaign 2 has a conversion rate of 2.87 percent, which is much higher than the Campaign 1 conversion rate of 1.88 percent, even though campaign 1 experienced a higher click-through rate and a lower cost per click. When making improvements to the CTR and the CPC, make sure the conversion rate is intact and improving.
2. Conversions from Paid Ads
Your business is not a cookie-cutter, out-of-the-box endeavor. It’s unique. That makes your marketing campaigns and metrics unique as well. Looking at the standard reports in Google Analytics will not cut it.
Say your online store carries high-ticket items and you are spending your marketing dollars on Google AdWords and paid ads on Facebook, Twitter, and LinkedIn.
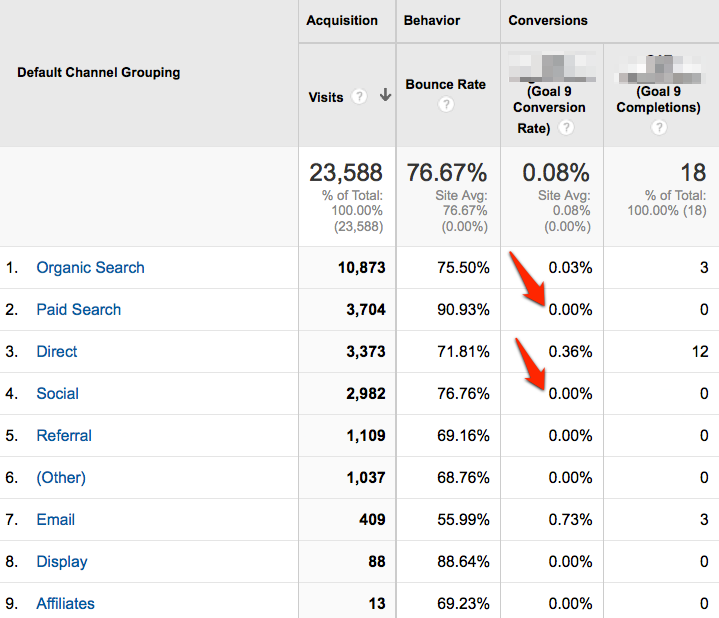
Then say you look at the Google Analytics channel report and see 18 conversions in total. You are delighted. But if you look further into the conversion of each of the channels, you quickly find that the paid search channel — as well as each social channel — has zero conversions. You were expecting a positive return on your marketing dollars, but that has not occurred.

Example of zero percent conversion on paid and social channels.
So you rush to turn off all the paid campaigns. But then you remember reading “Ecommerce Analytics for Multiple Devices, Channels,” my previous article addressing how consumers visit a website many times before they eventually buy. It’s possible that paid and social ad efforts are helping in the upper funnel by generating awareness about products and engaging prospects early in their buying cycle. So you keep the campaigns running and start paying attention to the multi-channel funnel reports.
3. Multi-channel Conversion Funnels
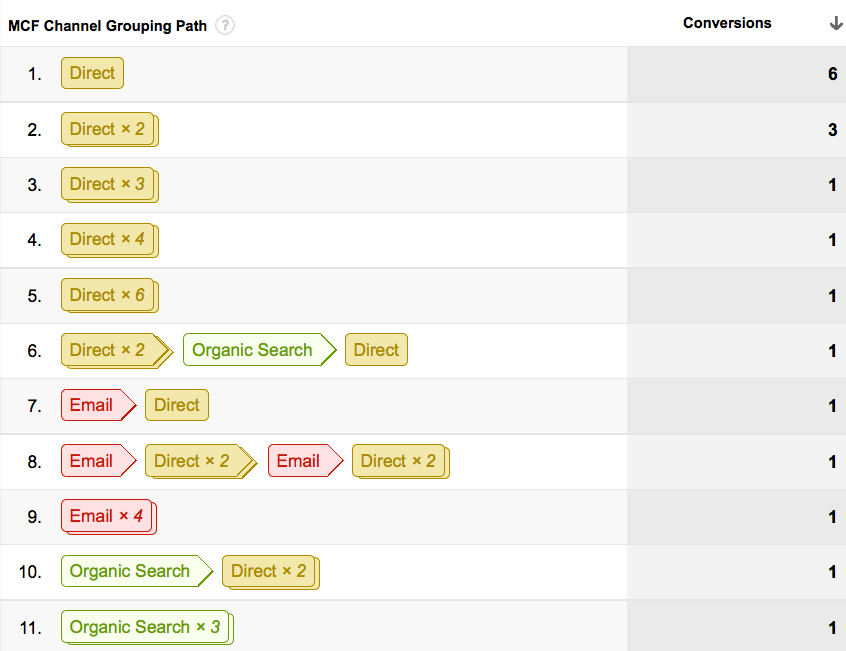
Say you navigate to Google Analytics > Conversions > Multi-Channel Funnels > Top Conversion Paths, look at the data, and set up the look-back window to 90 days — telling Google Analytics to give you all the previous interactions leading to this last touch conversion. You are really hoping to see social and paid ads in the early stages of the conversion paths.

Multi-channel funnel data.
To your dismay, social and paid search appear to have no contribution or attribution to any of these conversions.
You are really worried now. You are not seeing the return on the money you are spending on paid search. Before we pull the plug on these campaigns, you think of the phone orders you take, and maybe these paid campaigns are driving people to the site and then prospects are calling, speaking with your customer support team, and then buying offline. These over-the-phone sales will not show in your standard Google Analytics reports.
Don’t treat offline and phone orders separately from online channels — both should be informing each other. In the example above, and after collecting data from callers, customers did confirm that they are clicking on ads. So the campaigns were working but not in a way that can be tracked in web analytics.

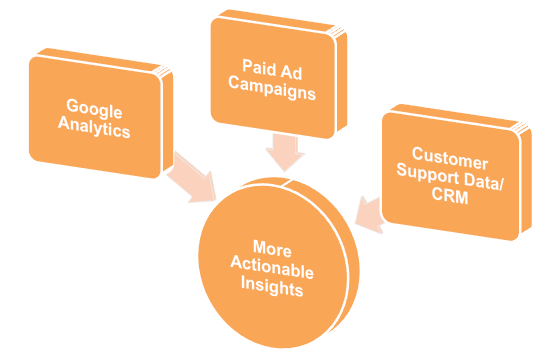
Multiple data sources can make tracking customer purchases more actionable.
To go beyond the standard multi-channel reports to find actionable data, try the following actions.
- Ask customers. Train your sales and customer support staff to politely ask customers how they found out about your business. You can also have a drop down menu with “How did you find about us?” in the purchase process, or send a follow up survey. You won’t get every caller to give you all the details on how they found you, but people will generally reciprocate and share. What you are looking for here is not 100 percent precision, but rather a signal to indicate if certain channels are working for you.
- Analyze responses. Collect this customer information and analyze it as you would trend your web analytics data.
- Turn off a campaign. You can also run a limited test that turns off a campaign, and then monitor sales.
- Import data into Google Analytics. Universal Analytics, the new version of Google Analytics, allows importing data in Google Analytics — to see your offline data and online data all within the Google Analytics interface.


