Overall, Google Analytics has a clean and intuitive interface. But, somehow, useful capabilities sometimes get lost on the screen. Two such features are the “Ecommerce” metric group and “weighted sorting.”
The Ecommerce Metric Group
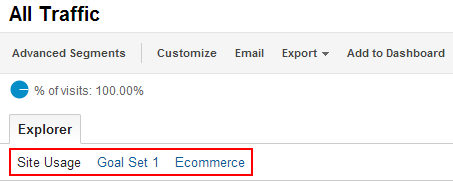
Every standard report has one or more predefined “metric groups” at the top.
Standard reports have predefined metric groups.
The example above is from the Traffic Sources > Sources > All Sources report, which shows three metric groups for this account: “Site Usage,” “Goal Set 1,” and “Ecommerce.” Each group has a different set of metrics that are displayed in the data table of the report.
By default, the first metric group displays when you load a report. In the example above, this is Site Usage. The metrics in the report are: “Visits,” “Pages/Visit,” “Avg. Visit Duration,” “Percent New Visits,” and “Bounce Rate.” Those are useful metrics. They show you how many visits came to the site from each traffic source, how many pages they viewed per visit on average, what percentage of that traffic is from first-time visitors to the site, and so on.
But, what if you want to know how those traffic sources are delivering traffic that converts to an order, and how much revenue is generated from each source? The easiest way to get that information — conversions and revenue — is to click on the Ecommerce metric group. When you click that link, the metrics in the report table change to more ecommerce oriented metrics: Visits, Revenue, Transactions, Average Value, Ecommerce Conversion Rate, and Per Visit Value.
The Ecommerce Metric Group Appears in Many Standard Reports
While the Ecommerce metric group is not available by default in all reports — for instance, it is not in the Pages report — it is available in many of them.
I like to use the Ecommerce metric group in the “Top Events” report — Content > Events > Top Events. If, for instance, I have a custom event set up when someone adds a product to their cart, I can quickly see the conversion rate for visits that included at least one of those events. I can also get this data by building a custom segment based on the event value. But why do something in a more complicated way when you can do it simpler?
Further, if I have two different methods that shoppers can add products to their cart — maybe from a “quick view” overlay and also from the full product details pages — and I have my event tracking set up to distinguish between the two, I can compare if visitors that use one or the other convert at a higher rate.
When viewing the Ecommerce metric group on a report where a single visit can include multiple different occurrences of the main dimension in the report, the ecommerce data will get included multiple times, in multiple rows, in the report. For instance, if a single visitor adds a product to her cart, and we capture that action in an event called “Add to Cart” (for the Event Category) and she also clicks on an onsite promotion, which we capture with an event called “Onsite Promotion” (also for the Event Category) and she then makes a purchase, then both the “Add to Cart” row in the report and the “Onsite Promotion” row will include the transaction. This is something to be aware of, but not necessarily a concern.
Using Weighted Sorting within the Ecommerce Metric Group
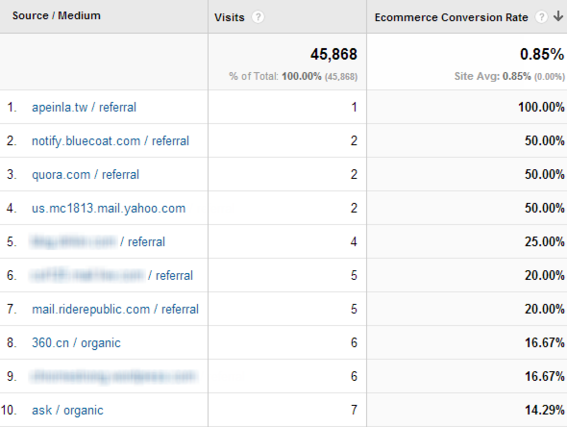
When using the Ecommerce metric group, you will almost certainly sort the report by conversion rate. If we sort the Traffic Sources > Sources > All Sources report — descending by Ecommerce Conversion Rate by clicking on the column header — the result is spectacularly unhelpful. The screen capture below has been modified to remove metrics that are extraneous to this example.
Sorting by conversion rate can be unhelpful without refining. Enlarge This Image
This is because sites that referred a very small amount of traffic that just happened to result in a single transaction wind up at the top of the report because of their phenomenally high conversion rates. But, this isn’t data you can really act on.
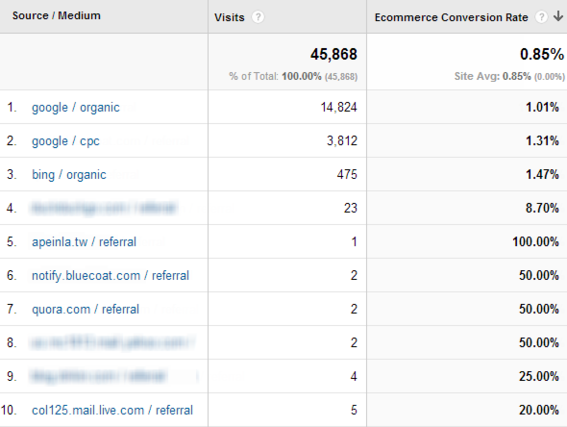
This is where another “you have to know where to look” feature of Google Analytics comes into play: weighted sorting. A more helpful view of this report would factor in the volume of traffic, or visits, into the sorting — topping the list with “Source/Medium” values that have both high traffic and high conversion rates.
Weighted sorting delivers better results. Enlarge This Image
To get from the initial sort, where the results are sorted strictly by the conversion rate, to this “weighted” sort, where the volume of traffic is factored in, takes two clicks: the “Sort Type” button at the top of the report and then “Weighted.”
Use the "Sort Type" drop down to sort by "Weighted."
Voila.
In this example, it’s clear that while Bing drives much less organic search traffic than Google, that traffic converts at an almost 50 percent higher rate: 1.01 vs. 1.47 percent. It also converts at a somewhat higher rate — 1.31 vs. 1.47 percent — than Google’s paid search referrals. It may be worth investigating to see if more emphasis on Bing — both for organic and paid search — is in order.
Final Notes
The Ecommerce metric group is not available in every standard report. But it can be recreated in a custom report simply by adding a metric group with the ecommerce metrics you want when you create the custom report. At the same time, weighted sort is not available for every metric — it only works for “percent” metrics. But, that makes sense, and that’s when you will find it most helpful.
Together, these two overlooked features can help you quickly identify opportunities, and problems.


